Step 4 - Assessing the F(Q)
Start the simulation running:
Ctrl-R
After just a few tens of steps you should see that the
 MD is doing what it’s supposed to and giving our framework a little bit of disorder as it flexes and vibrates:
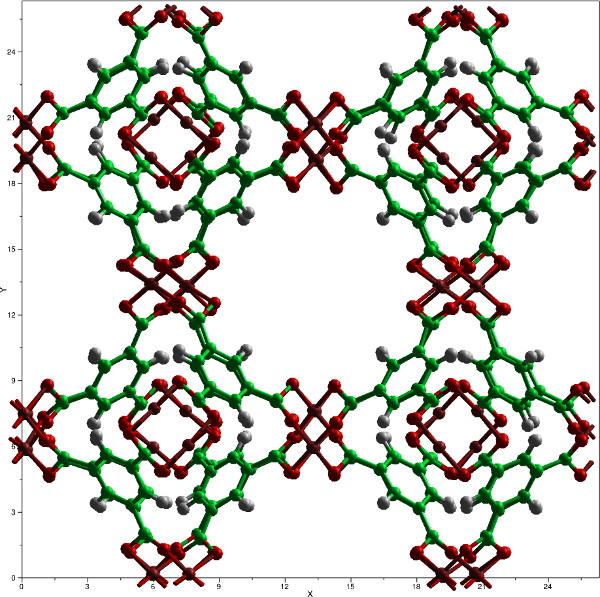
Cu-BTC at 300 K after several iterations of molecular dynamics
If we take a look at the output of the
 NeutronSQ we can see how our simulation compares to the experimental data:
Go to the
G(r) / Neutron S(Q) layer tab
Select the
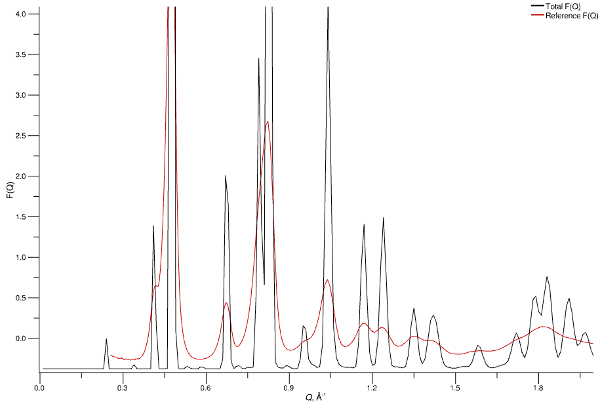
Comparison of simulated (black) and reference (red) total structure factors
We’ve zoomed in to quite a narrow $Q$ range (0 < $Q$ < 2.0 Å-1) in the above graphic in order to show in detail the Bragg peaks from the sample, and you’ll see that there is pretty good agreement between the simulated and experimental data in terms of positions, but the simulated data are way too sharp and need some broadening applied. The exact degree of broadening to be applied varies from sample to sample and depends on the crystallite size and uniformity, and the resolution of the instrument on which the data were measured. Without a calibrant sample - i.e. a crystalline sample of specific quality, crystallite size, and uniformity - against which to assess instrument resolution, a general broadening must be applied which accounts for all these possible factors.
We’ll make an initial guess as to the right broadening here - first we’ll try to get the peak widths at the lowest $Q$ values a bit better by applying a Q-independent factor:
Go to the
Click on the
SQ module to display its options
Find the Bragg Scattering options group and set the BraggQBroadening to
GaussianC2with a FWHM of0.05and a FWHM(x) of0.02
Now run the simulation for twenty steps or so:
Ctrl-F
Enter
20and click
Let’s go back to the
NeutronSQ module and see what the comparison looks like now:
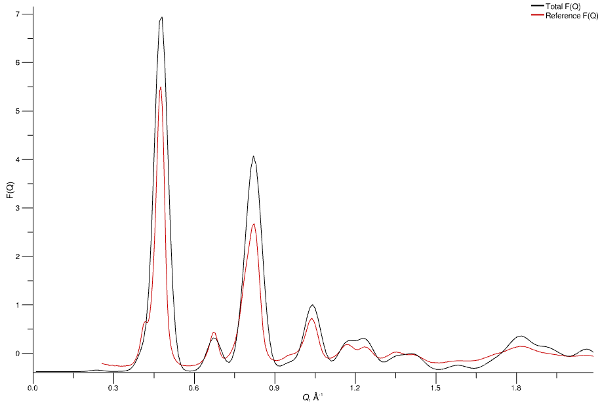
First broadening of simulated structure factors
As you can see this looks much better! We can still observe that as we go to Bragg peaks at higher $Q$ values are too intense, so we’ll increase the $Q$-dependent broadening as well:
Set the BraggQBroadening of the
GaussianC2with a FWHM of0.055and a FWHM(x) of0.03
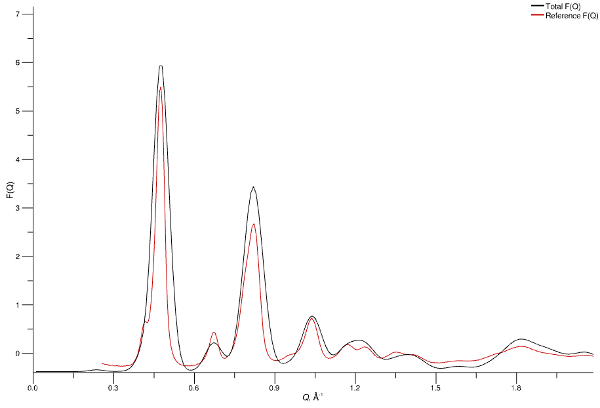
Second broadening of simulated structure factors
Not looking too bad considering we haven’t taken account of the NIMROD instrument’s “interesting” peak shape, and are representing our Bragg peaks as simple Gaussians.