Step 5 - Assessing the G(r)
Let;s now turn our attention to the total radial distribution function:
Go to the
G(r) / Neutron S(Q) layer tab
Select the
NeutronSQ module and go to its tab
Click on
You should see something similar to this:
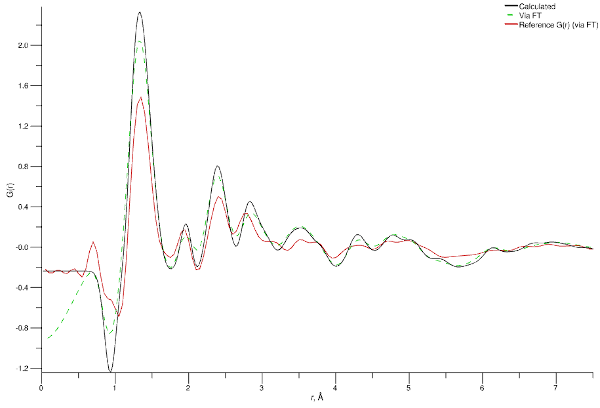
Cu-BTC G(r) at 300 K from simulation (black line) and experiment (red line)
Again, not bad - the forcefield is doing a decent job of reproducing the experimental structure. While many of the peaks are present and occur at the correct distances there are a couple that are slightly off the mark. We can assign those peaks to families of structural correlations (or specific ones if you’re lucky) by cross-referencing the peak positions with either the equilibrium values for forcefield bond terms (for the lowest $r$ values) or the distances between atoms at the termini of angle interactions. For the latter these values must be worked out by hand since the angle terms typically specify equilibrium angles instead than distances, so get your trigonometry sharpened up (or look at the individual g(r) for those atom types and read off the peak distance).
The following table does this for the first few peaks.
| Experimental $r$, Å | Simulated $r$, Å | (Possible) Peak Assignment |
|---|---|---|
| 0.9 - 1.06 | 0.94 | C–H (benzene ring) |
| 1.34 | 1.33 | C–C (benzene ring) and C–O |
| 1.92 | 1.96 | Cu–O and C(2)–H (benzene ring) |
| 2.4 | 2.39 | C(2)–O (angle) and C(3)–C(3) (angle) |
| 2.77 | 2.83 | C(3)–O (proximity) |
One note of caution - we are assuming here that the experimental structure is as “clean” as that of the model. Adsorbed molecules or impurities / inconsistencies in the MOF structure may also be responsible for the observed differences between model and reality.
It is prudent to adjust bond distances in the forcefield at this point in order to get better agreement. While this is possible to an extent for small molecular systems, for a periodic framework it is considerably more difficult, but we’ll try anyway! Let’s start with the Cu–O interaction occurring in the experimental at 1.92 Å, and which our forcefield is over-estimating.
Go to the
Forcefield tab, Master Terms section
Find the
Cu-Obond interaction and change the value of the eq parameter from1.969to1.94
We need to run the simulation long enough to allow the
 GR module to re-average its data, which is accumulated over five datasets and collected every five iterations.
Ctrl-F
Enter
25and click
Once these steps are completed, the simulation should now show much better agreement with the experimental data at 1.92 Å.